Gisela Zimmermann · 24 October 2026
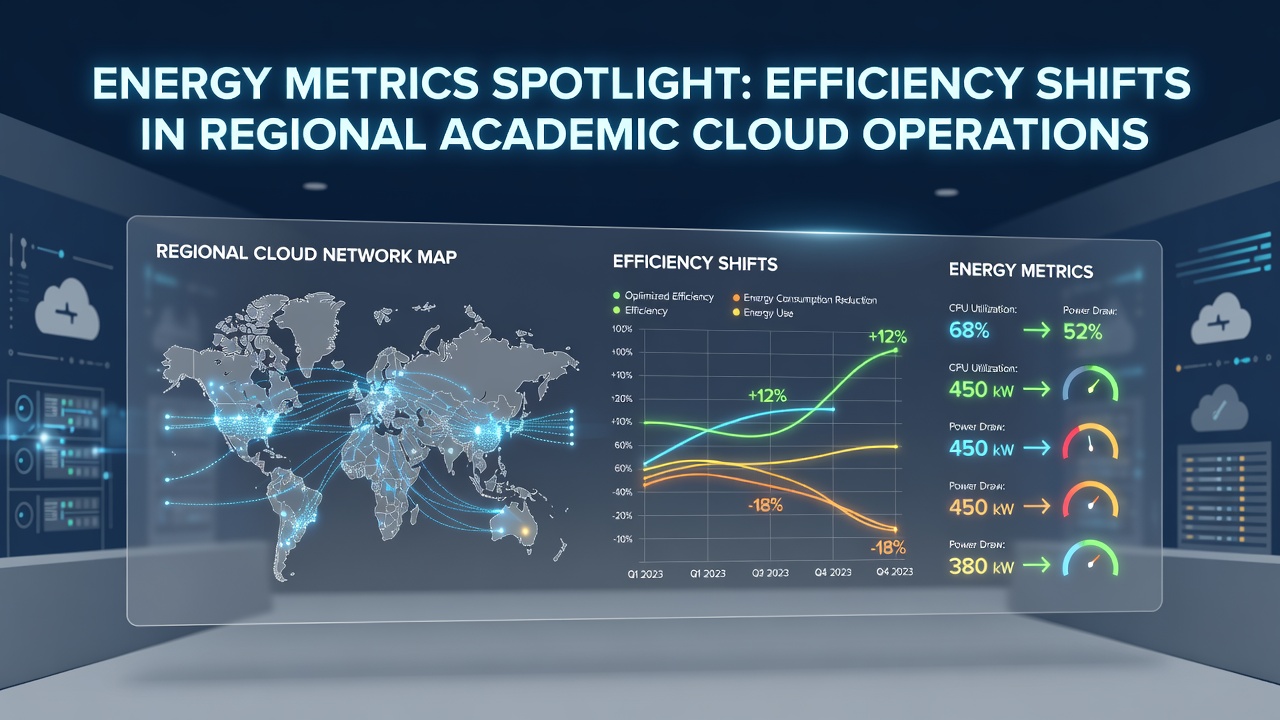
Energy Metrics Spotlight Efficiency Shifts in Regional Academic Cloud Operations
Regional academic institutions have turned increasing attention toward energy metrics as a core component of cloud infrastructure management, with data centers supporting research and teaching workloads showing measurable changes in consumption patterns through 2026. Observers note that universities operating shared cloud platforms now track power usage effectiveness alongside carbon intensity indicators, allowing administrators to compare performance across facilities that range from legacy on-premises clusters to hybrid deployments managed through regional consortia.
Tracking Consumption Patterns in University Environments
Energy monitoring systems deployed at several mid-sized institutions have recorded shifts in baseline loads since the expansion of containerized research workloads, where virtualized environments for data analysis and simulation now account for larger portions of daily draw. Figures from facility logs indicate that peak demand periods align with semester deadlines when batch processing jobs for genomic sequencing or climate modeling run continuously, yet overall utilization rates have stabilized because of automated scaling policies that idle idle resources during lower activity windows. Researchers at institutions participating in cross-border networks have documented how these adjustments correlate with reduced nighttime consumption, a change that becomes visible when comparing October 2026 readings against the same month two years earlier.
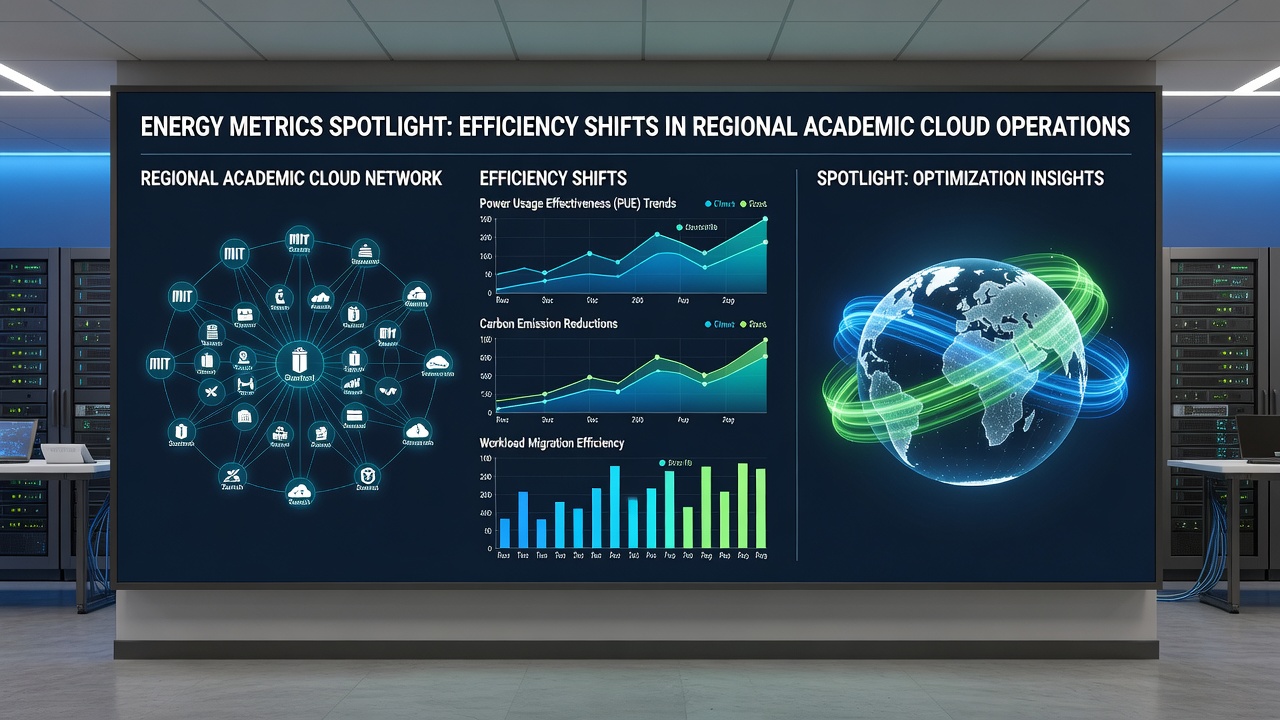
Standard metrics such as power usage effectiveness remain central to these evaluations, while newer indicators incorporate water usage for cooling and embodied carbon in hardware refresh cycles. Teams responsible for operations report that integrating these measurements into existing monitoring dashboards has required updates to data pipelines, yet the resulting visibility supports decisions on workload placement across sites with differing energy mixes.
Adoption of Advanced Measurement Tools
Software platforms designed for granular energy attribution now appear in several academic clouds, mapping individual research projects to specific server racks and their associated power draw. One implementation at a consortium serving multiple technical universities assigns energy costs directly to grant-funded accounts, creating incentives for researchers to optimize code efficiency before submitting large-scale jobs. Data collected through these tools reveal that machine learning training runs frequently dominate energy profiles, prompting administrators to schedule such tasks during periods of higher renewable availability reported by grid operators.
Coordination with national grid authorities has also increased, as universities seek access to real-time carbon intensity signals that allow dynamic shifting of non-urgent computations. According to reports from the European Environment Agency, educational sector data centers represent a growing share of institutional energy budgets, which has driven interest in standardized reporting frameworks that align with broader EU sustainability directives. Similar approaches appear in North American university networks, where the U.S. Department of Energy has published guidance on applying efficiency benchmarks to research computing facilities.
Comparative Performance Across Sites
Comparative studies conducted by regional network operators show variation in efficiency outcomes depending on hardware age and cooling technology. Facilities that completed partial upgrades to liquid cooling loops demonstrate lower power usage effectiveness values during summer months, while sites relying on traditional air systems continue to experience higher seasonal spikes. Those who have studied the datasets point out that the gap narrows when virtualization density increases, because fewer physical servers handle equivalent workloads. A project tracking six institutions over eighteen months found that average efficiency improved by measurable margins after migration of storage-intensive services to centralized regional hubs.
Training programs for systems administrators now incorporate modules on interpreting energy dashboards alongside traditional uptime and throughput statistics. Participants learn to identify stranded capacity that contributes to unnecessary baseline consumption, and several universities have since implemented automated policies that decommission underutilized nodes during academic breaks. Such operational changes appear in logs as sustained reductions in idle power draw without corresponding drops in completed job counts.
Outlook for Continued Refinement
Future reporting cycles are expected to incorporate additional variables such as embodied emissions from server manufacturing and end-of-life recycling rates. Regional consortia have begun piloting shared dashboards that aggregate anonymized metrics from member institutions, enabling benchmarking without exposing sensitive operational details. As these practices spread, the emphasis remains on verifiable measurements that support both internal budgeting and external compliance requirements.
Conclusion
Energy metrics continue to shape operational decisions in academic cloud environments, providing institutions with concrete data to guide infrastructure adjustments. The combination of established indicators and emerging tools has produced observable shifts in consumption profiles across the region, with October 2026 serving as a reference point for ongoing comparisons. Institutions that maintain consistent measurement practices position themselves to respond to evolving grid conditions and regulatory expectations while sustaining research computing capacity.